
Together with Hula Earth and planted, we monitor our 5,000 m² project area - and find out how our ecosystem is doing.
Insights into our forest conservation project
A few months ago, we launched our Forest protection project at Mühlriegel started. Now we would like to show you what actually happens there, how we monitor the condition of the area - and why not only forester knowledge but also high-tech is used.
Together with our partners planted and Hula Earth we rely on precise remote sensing and data analysis to continuously measure ecological development.
How our project area is monitored
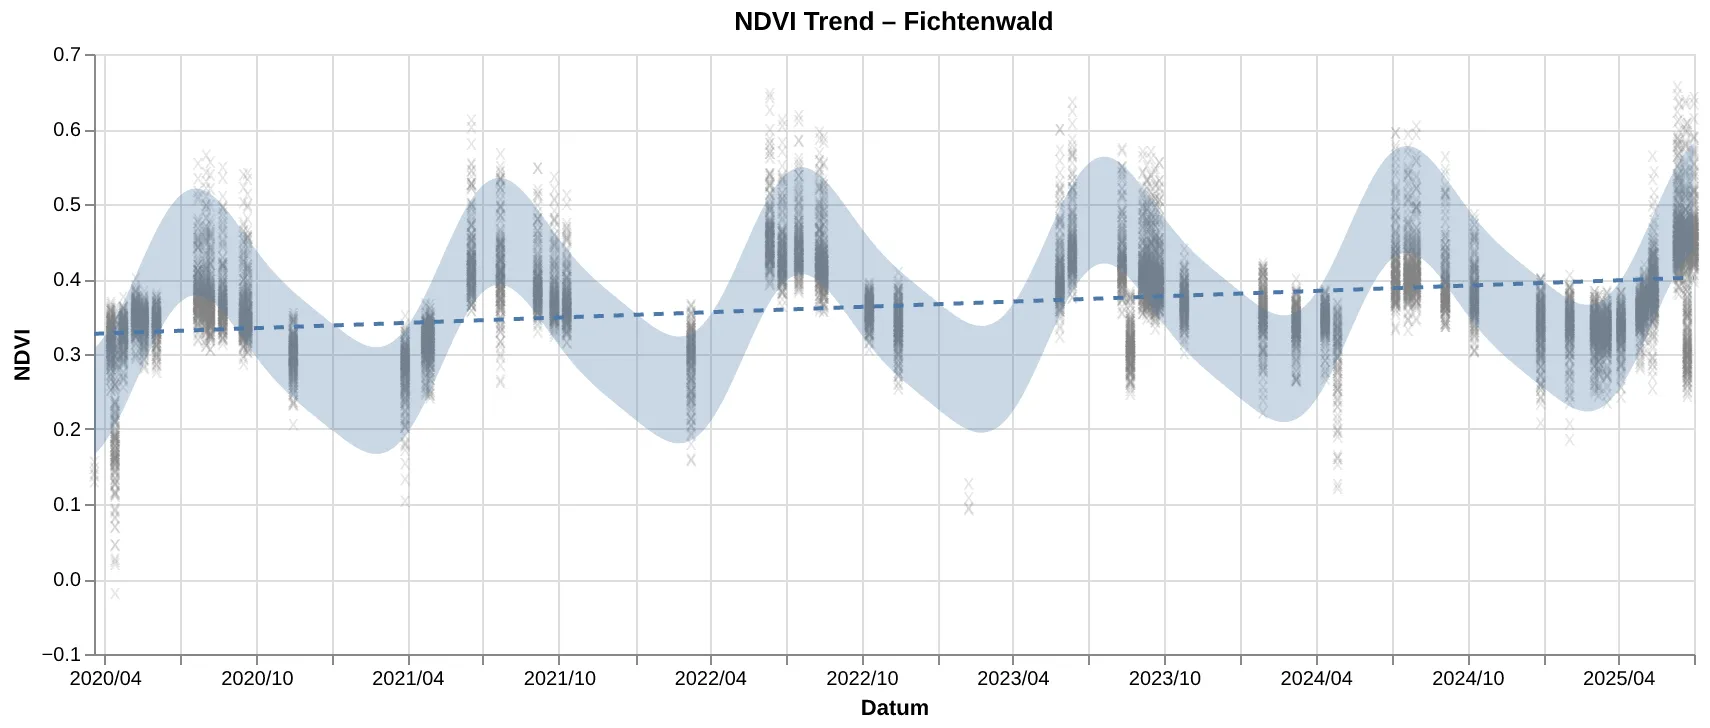
Hula Earth uses various satellite data sources, in particular the Sentinel-2 mission of the European Space Agency ESA. This provides images every five days in 13 spectral bands with a resolution of up to 10 meters - perfect for Time series analyses of the vegetation condition.
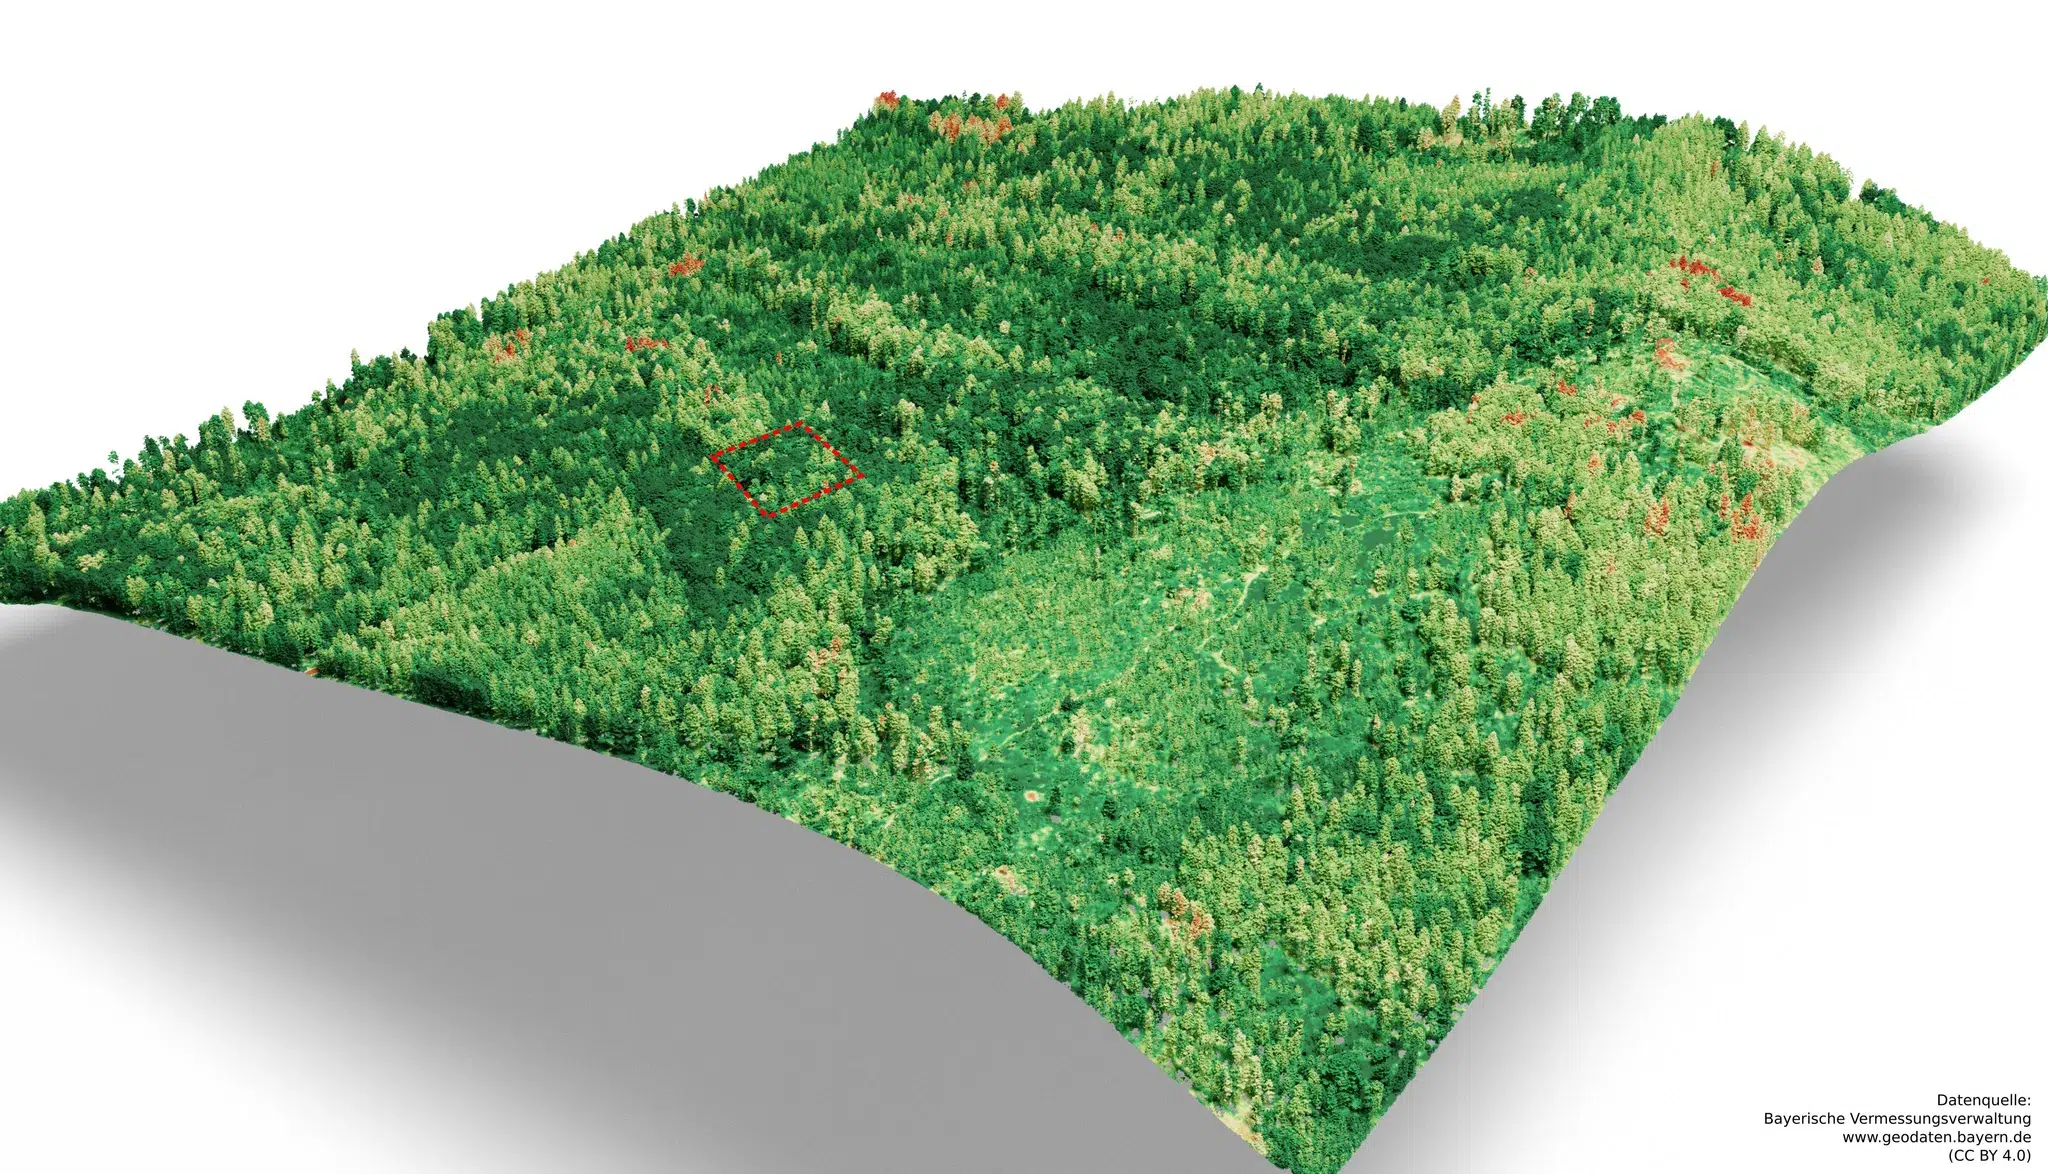
For high-resolution displays on the 3D model our area, additional data from the Bavarian State Office for Surveying used. In addition to precise LIDAR point clouds (up to 500 points/m²), the office also provides RGB+infrared aerial imagesfrom which the NDVI (Normalized Difference Vegetation Index) with a much finer spatial resolution.
In short:
-
Time series = Sentinel-2 NDVI
-
3D mapping = NDVI from Bavarian aerial photographs
CO₂: Absorbed does not equal bound
Since 2023, the area has been around 9 tons of carbon absorbed (net primary production, NPP). However, this figure includes all formed plant components - including leaves, whose carbon is released back into the atmosphere in the fall.
Long-term bound in the ecosystem are after two years about 5 tons - a value that fits well with typical binding rates of 6-7 tons per hectare and year, considering our project size of 0.5 ha.
It is important for us to make this distinction transparent: Not every short-term uptake is a permanent contribution to climate protection.
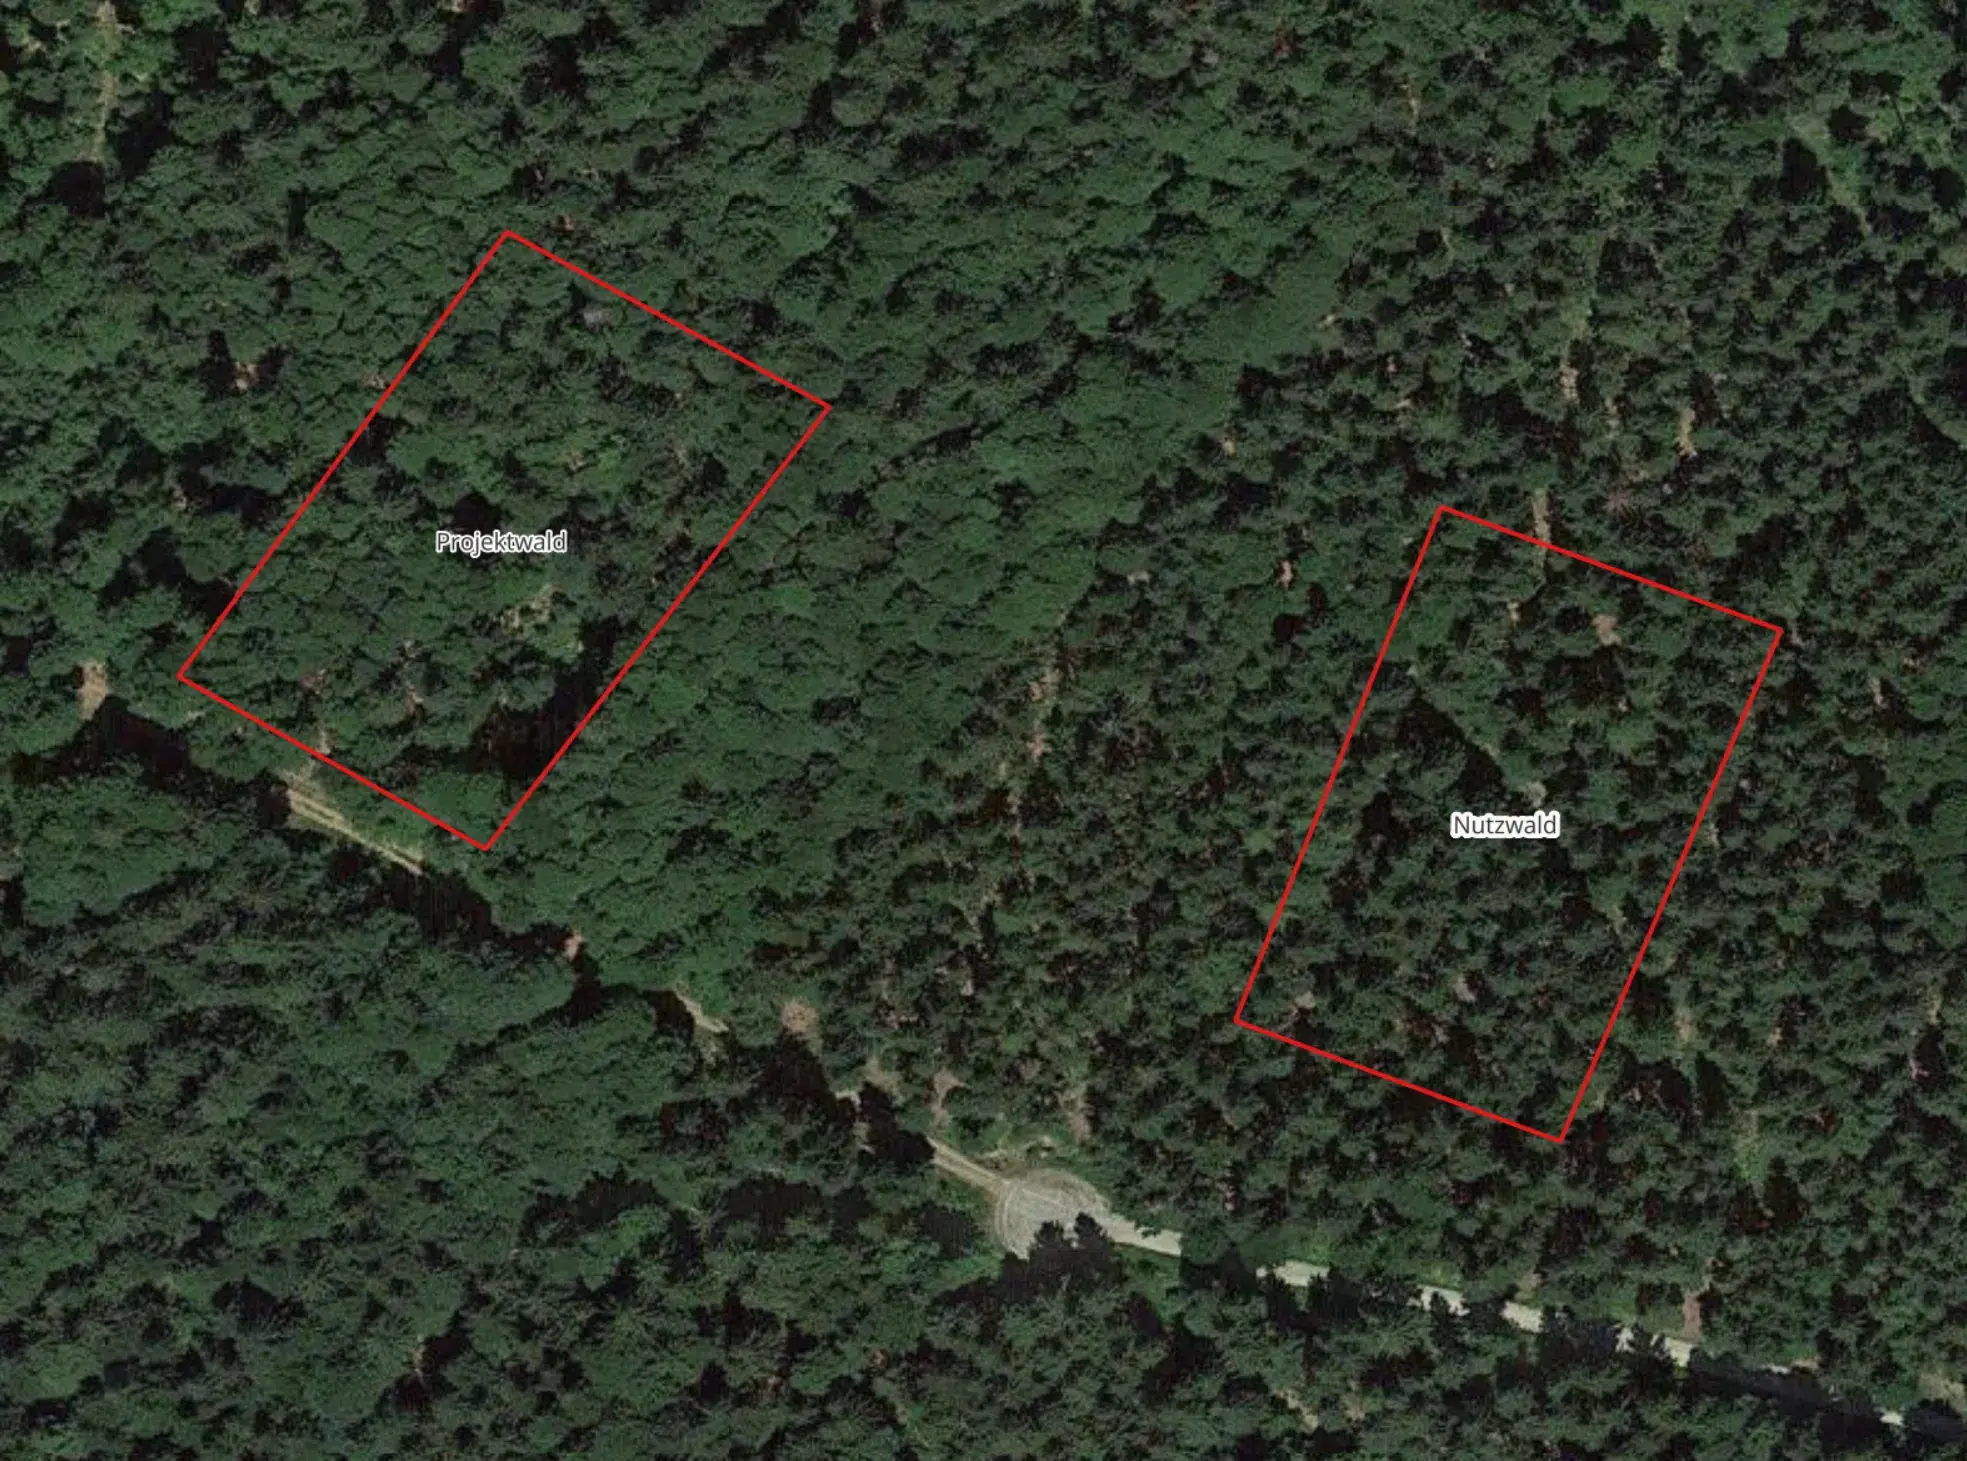
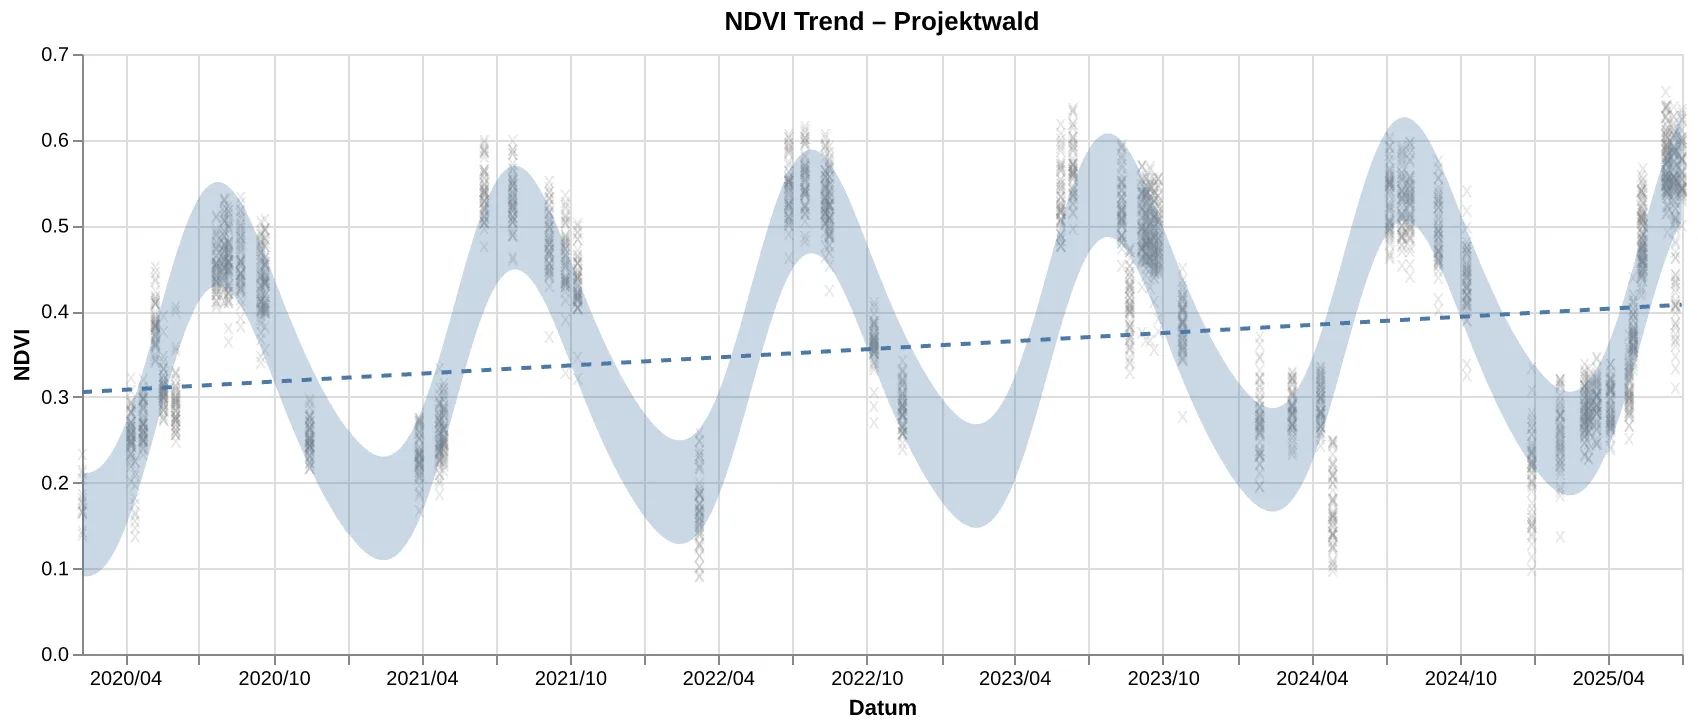
NDVI: The vegetation health check
The NDVI measures how vital plants are - the higher the value, the healthier the vegetation.
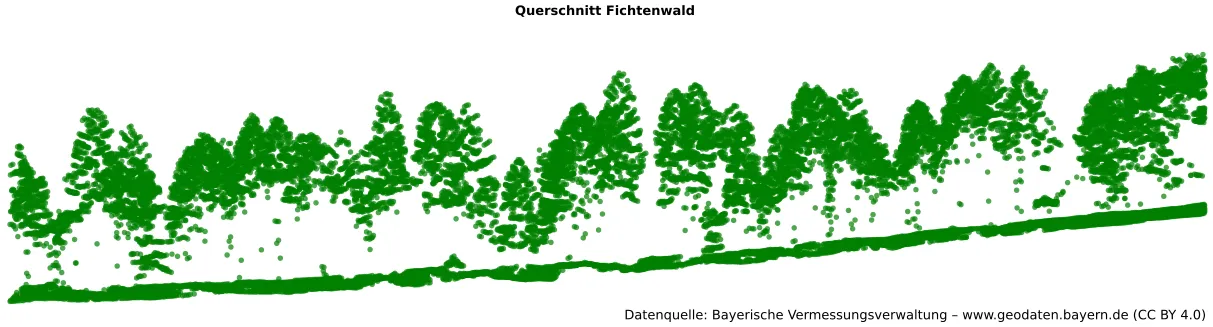
Compared to the directly adjacent Spruce monoculture forest shows our project area:
-
Clear positive NDVI trend = more vitality
-
Greater variability = greater structural diversity
-
Monoculture = more even, predictable values with low amplitude
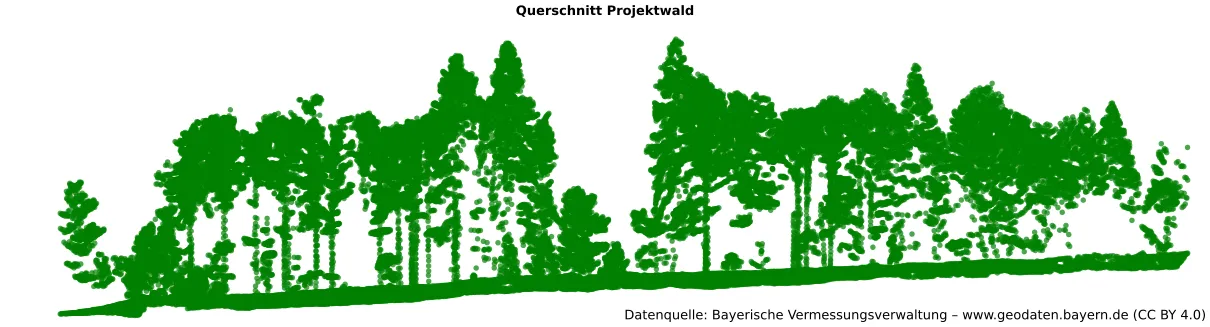
3D mapping of diversity
Thanks to the LIDAR data, an exact 3D model of our forest. The high-resolution NDVI is projected onto this model.
The result: a clear map showing tree heights and densities as well as differences in vitality. The diversity of structures is a clear indicator of a developing, stable ecosystem.
Conclusion - and an outlook
Our forest conservation project is an example of how Technology and nature conservation go hand in hand can go. Thanks to precise data, we know exactly how our area is developing - and can demonstrate progress or the need for action.
And for all nature lovers: There will soon be an update on the bird calls and other animal inhabitants - stay tuned!
